


90.6% of Shopify stores do not move visitors through their site efficiently enough.
Yet when it comes time to solve this, few, if any, have a clear understanding of where their conversion rate problems are.
Instead they rely exclusively on metrics like a global store conversion rate, or in-app performance metrics in Google, Meta, or a 3rd party attribution tool.
This scenario allows brands to spend an absurd amount of time guessing what is wrong with their store, without remotely equipping them with a structure to fix it.
That lack of structure is endemic to most ecommerce brands in 2025. They are exhausted by apps, hacks, and quick fixes. They have endless data points available to them. But what they lack most at the end of the day is a way to turn that data into direction.
Enter the Intra-Site Funnel, the most approachable way to understand and improve on-site performance for Shopify brands.
Rather than looking solely at conversion rate, the Intra-Site Funnel creates an accessible analytics structure that shows:
- Step-by-step, where you are losing visitors on your site (more than you should be)
- How your store compares to established target ranges
- How behavior differs based on user intent
- And so much more
Why the Intra-Site Funnel is better than Conversion Rate.
Ask a store owner what their conversion rate is and they can probably give you an answer pretty quickly. After all, it is prominently displayed in the Shopify analytics overview.
Then ask them “what actions do you take based on that number”?
Outside of inducing panic when it goes down, that online store conversion rate does very little to inform what to do next.
It doesn’t show you collections pages that cause users to exit. Or how well high/low-intent users are adding to their carts.
It is too broad of a figure, to do much with. And it is too beholden to seasonality, promotions, etc. to look provide helpful context over time.
Those reasons, and many more, are why we recommend the Intra-Site Funnel instead.
So what is the Intra-Site Funnel?
It is conversion rate broken up into four individual behaviors.
- Landing on Site → Viewing a Product
- Viewing a Product → Adding to Cart
- Adding to Cart → Beginning Checkout
- Beginning Checkout → Complete a Purchase
When you look at each behavior in isolation, you can see that maybe you don’t have a conversion rate problem. In reality you have a Product View → Add to Cart problem and once you get users to add to cart, they complete a checkout at sufficiently high rates.
Plus, with this narrower view you can easily layer in additional data points for better context, such as device type, traffic channel, new vs. returning.
The Core Steps of the Intra-Site Funnel
Step 1 | Landing → Product View
How well a user advances from landing on the site to reaching a product page.
Target Range: 50-70%
Step 2 | Product View → Add to Cart
How effective are your product pages at compelling users to add an item to their cart?
Target Range: 12-18%
Step 3 | Add to Cart → Begin Checkout
How efficiently can you transition users from a shopping experience to a checkout experience?
Target Range: 40-60%
Step 4 | Begin Checkout → Purchase
Once in checkout, how effectively can you guide users over the finish line?
Target Range: 45-60%
How the Intra-Site Funnel differs from Conversion Rate
With conversion rate alone, when performance suffers you are stuck trying to problem solve only on the end result. You have no ability to zoom in on an issue, or even know if you are solving the right one.
That ability to zoom in allows you to be more efficient with your CRO efforts. If you only have a few hours a week to problem solve, you’ll get far better results testing out solutions to a single problem than attempting to solve five at once.
Knowing the main problem area of your site allows you to safely ignore what is working on the site and aggressively focus on what isn’t. We call that your Metric on Fire.
How a Metric on Fire works
By now it should be clear that when your site has conversion rate issues the problem is probably narrower than that.
Put simply, your Metric on Fire is the biggest issue facing your store’s Intra-Site Funnel. And, in almost every scenario, it is an issue that will not self-correct. It will continue to burn in the background until you do something to fix it.
On the plus side however, by identifying a Metric on Fire and prioritizing your efforts around solving it, you are also tackling your biggest opportunities for improved on-site performance.
Unlike conventional CRO prioritization methods, narrowly focusing on a single problem that is underperforming means that every test, tweak, change you make is pulling the biggest lever possible. No more tinkering around the edges on things that are important.
You can move the needle more in 90 days of A/B testing focused around a Metric on Fire than nine months of spaghetti testing everything on your site.
The Most Common Problems the Intra-Site Funnel Solves
Once applied the Intra-Site Funnel becomes a compass of sorts for your store. It provides context and direction for where you are currently. When applied properly, it can help guide you to solutions on almost any kind of CRO related problem. Here are three of the main problems we see it excel at solving.
Product Discovery
Most stores don’t recognize that they have issues with product discovery. Yet 70% of Shopify stores struggle on this particular step.
Often times this issue is masked by their marketing strategy. If 50-60% of your users land directly on a PDP, Landing → Product View might look pretty good. However, if you exclude those users, and suddenly only 3 out of 10 people view a product - you have a problem.
This commonly shows up on one of two places:
- Homepage → Product View
- Collection Page → Product View
70% abandonment is not uncommon in those locations. Worse yet, these tend to be repeat visitors with higher intent. Of all the customers you don’t want to lose while shopping, these a pretty far up the list.
If you are able to improve progression from a homepage / PLP to a PDP, you in effect gain free product views.
Many in ecommerce will downplay the importance. But we have seen time and time again, for every 2-3% you increase product view rates, you will see a 1% increase in revenue per visitor. When it comes to getting more revenue out of your existing traffic, solving this problem is a surefire way to accomplish that.
Cold Traffic Performance
Most ecom brands live and die by their Meta performance. The customer journey is relatively straightforward:
- View Meta Ad > Click Ad > Land on PDP
Yet there is often a world of difference between the pre-click experience of a descriptive ad with exciting create and copy and what the users sees when they land on the site.
Too often they are met with a generic experience that doesn’t reassure them they are in the right place. Nor does it speak to their reasons for click on the ad in the first place. It is simply a few images, a buy box, and an add to cart button following them up and down the page.
That is why PDP > Cart performance for paid social traffic is vital. If this rate is hovering beneath 5%, you are in a world of hurt. Something is amiss between the pre- and post-click experience, and if you do not fix it you will be lighting money on fire whenever you try to scale your ad spend.
Many times when beginning with brands, their PDP > Cart rate is 2-4%. In every scenario we are able to significantly increase that in 90-180 days. Often upwards of 20% every 90 days. Even on high consideration products with hefty price tags there is no reason you cannot achieve an 8-10% PDP > Add to Cart rate.
Cart Abandonment
Most brands fixate heavily on the bottom of the funnel. Any loss in cart (or checkout) feels personal.
The reality is, most brands do pretty well out of the gate on these steps. And, when we crunched the numbers in our 2025 Intra-Site Funnel Benchmark Report, the gap between the highest and lowest performers simply isn’t that large.
The real challenge with cart abandonment is balancing the urge for average order value tactics with the need for high progression rates.
Most of the time we see a poor Cart → Checkout rate the mobile cart experience is overwhelming, or there are unnecessary steps added in (e.g., upsell flows) that annoy users and cause premature exits.
For most brands, in most cases, Revenue Per Visitor is higher when you prioritize Cart → Checkout advancement versus AOV. The incremental gains you get from add-ons and up-sells is simply worth less than getting more users into checkout, even at a slightly lower order value.
Adopting the Intra-Site Funnel to your store.
Even beyond what is already covered the best part about the Intra-Site Funnel is its practicality. It is not a theoretical concept that sounds great in practice, but struggles in reality. It is built 100% for the needs of modern ecommerce teams.
It is brutally simple and easy to learn.
You can setup your own Intra-Site Funnel report in GA4 in less than five minutes. More detailed instructions can be found in the Definitive Guide to the Intra-Site Funnel.
Setting up your own Intra-Site Funnel Report.
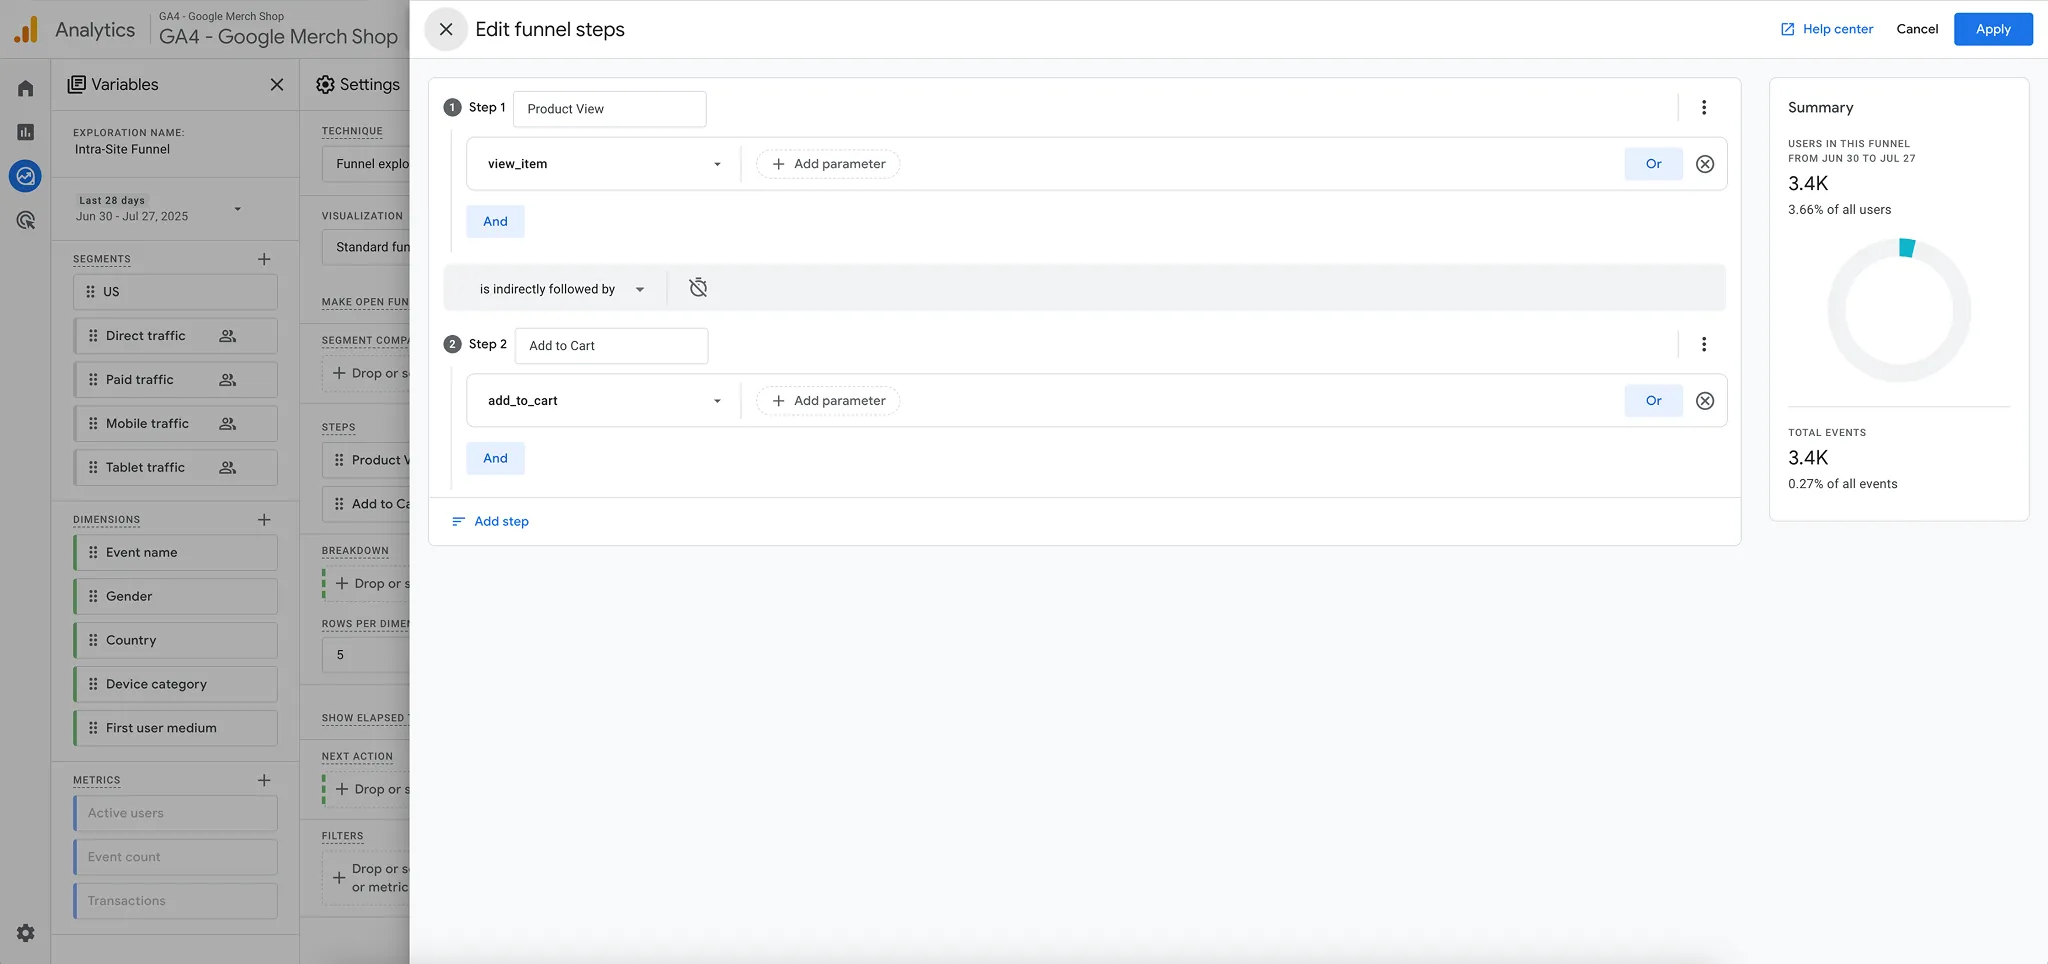
- Open your GA4 instance
- Navigate to the explore tab, select a “funnel exploration”
- Add in the ISF steps, two at a time, by editing the “steps” button
We recommend making each behavior its own tab.
Logic for each Intra-Site Funnel step
Landing → Product View
Step 1. Landing: landing page + query string contains /
Step 2. Product View: view_item
Create Product View → Add to Cart tab
Step 1. Product View: view_item
Step 2. Add to Cart: add_to_cart
Create Add to Cart → Begin Checkout tab
Step 1. Add to Cart: add_to_cart
Step 2. Begin Checkout: begin_checkout
Create Begin Checkout → Purchase tab
Step 1. Begin Checkout: begin_checkout
Step 2. Purchase: purchase
Analyzing your store’s performance
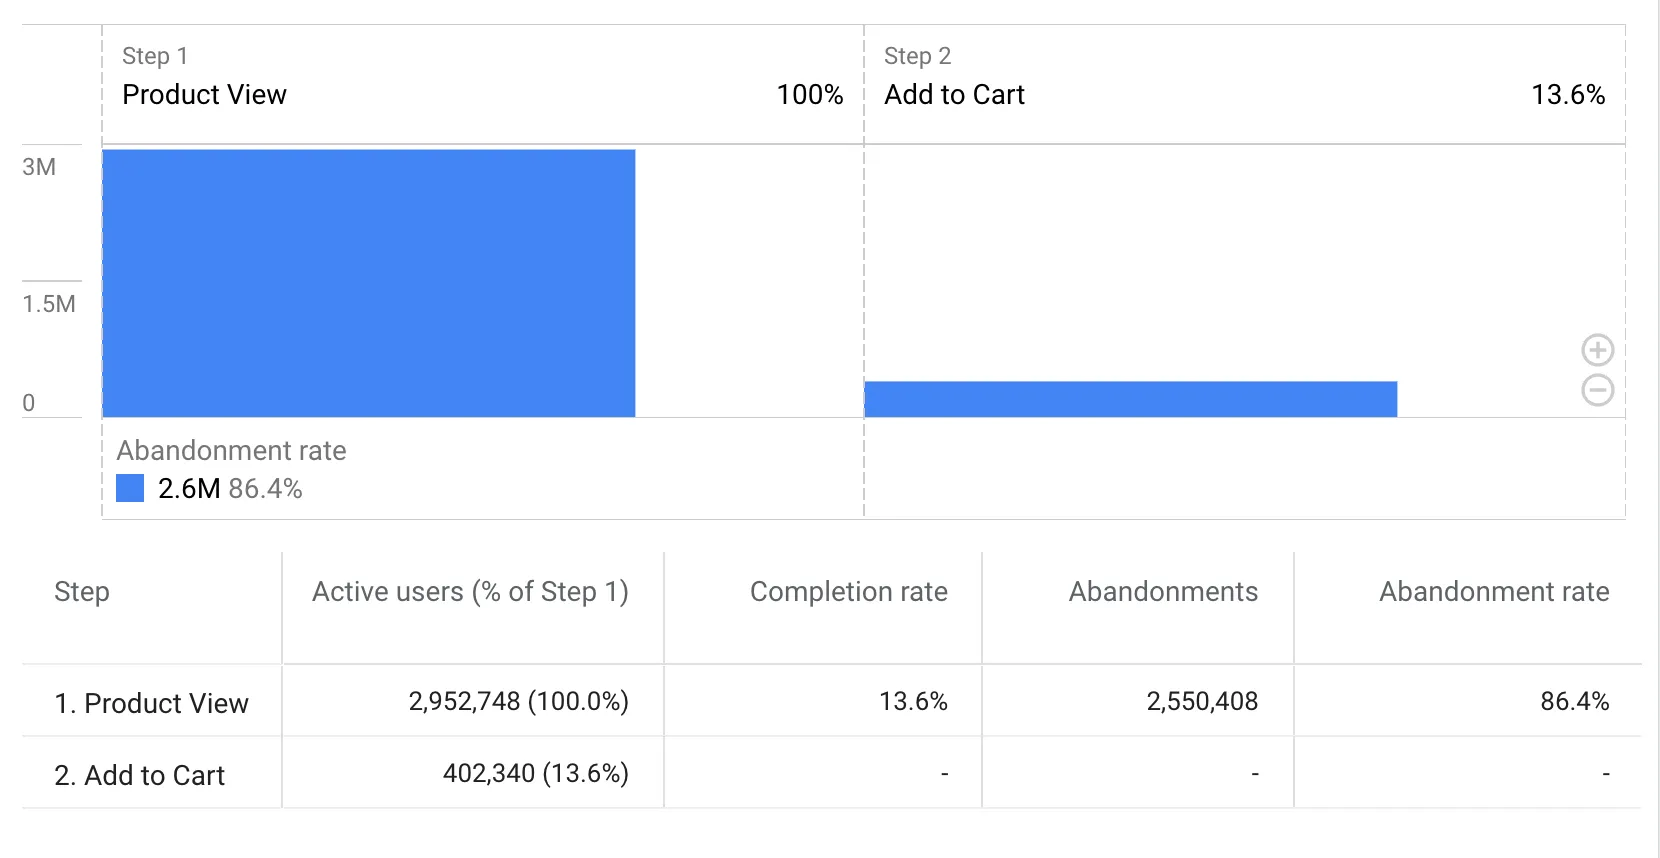
Once you finish, the report will show four columns of data: active users, completion rate, abandonments, abandonment rate. Completion rate is the metric you need to focus on.
Use that completion rate to compare your store against the target benchmarks.
Landing → Product View
Target Range: 50-70%
Product View → Add to Cart
Target Range: 12-18%
Add to Cart → Begin Checkout
Target Range: 40-60%
Begin Checkout → Purchase
Target Range: 45-60%
Whichever behavior your store scores the lowest on relative to the low-end target range is your Metric on Fire.
Checkout a full video breakdown here.
Conclusion
The Intra-Site Funnel is built to be an approachable and actionable way to improve CRO efforts for your Shopify store.
If you take what you learned here, you can very easily begin to diagnose what is going on with your store, and where you need to focus your efforts the most.
As you get more familiar with using it you can layer in different dimensions (device category, session source/medium, etc.) to surgically understand what is going on with your store.
If you need an expert opinion on how to approach optimizing your store, reach out to have us conduct one of our acclaimed Conversion Audits for your brand.
